TradingKey - As of the close on September 17 Eastern Time, SanDisk (SNDK) stock rose 6.21% in a single day to $1,614.39, reaching an intraday high of $1,625.36, ending its previous continuous pullback.
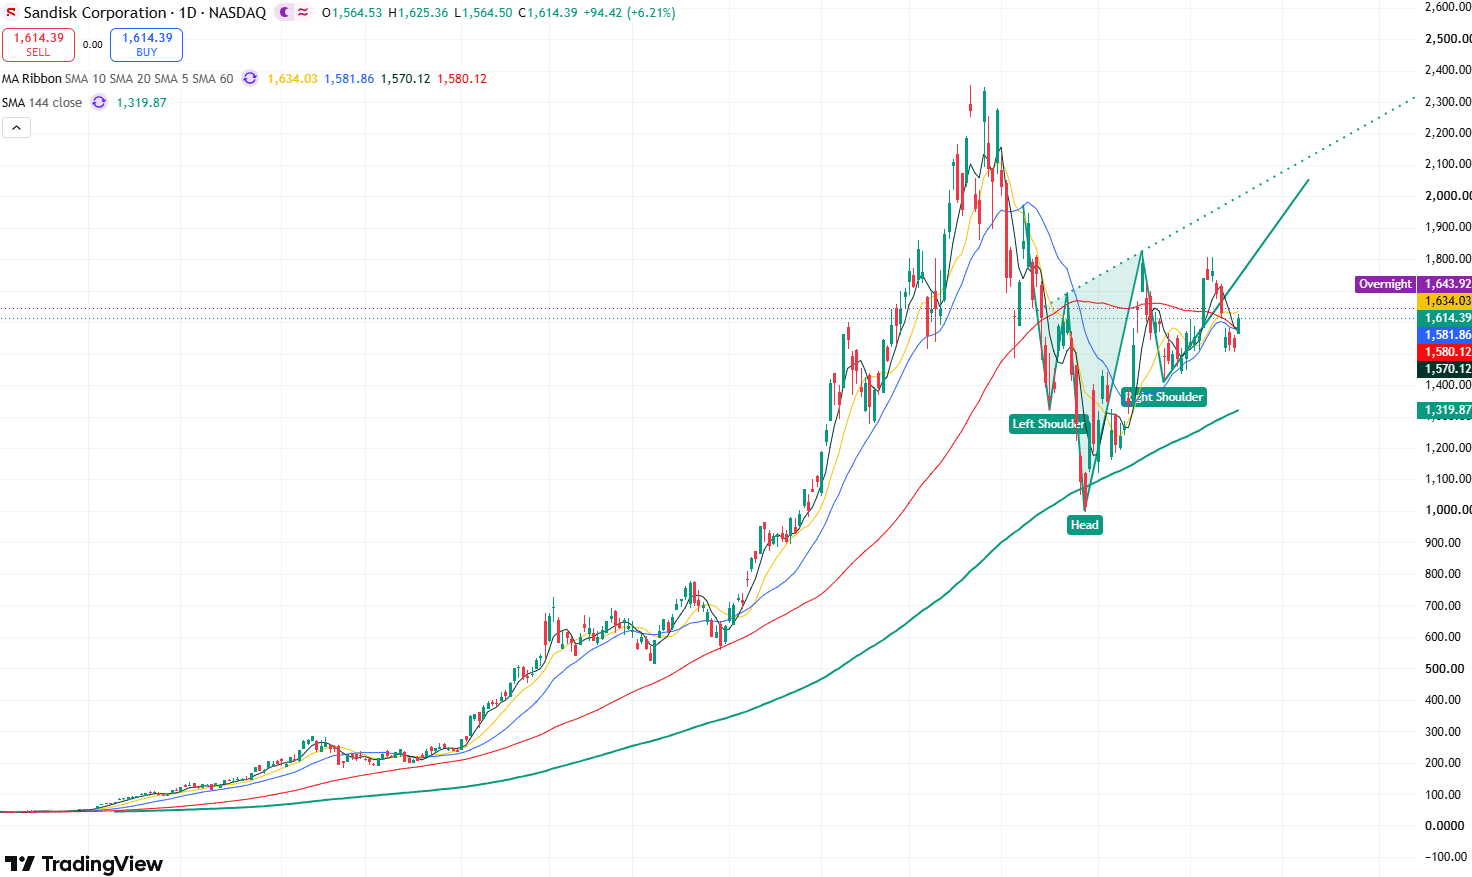
SanDisk daily stock price chart, Source: TradingView
Looking at the daily chart of SanDisk's stock price, the stock has reclaimed the 20-day moving average ($1,582) and the 60-day moving average ($1,580), improving its short-term bullish structure. Meanwhile, the candlestick remains above the 144-day moving average, showing that the medium- to long-term bullish trend has not been damaged.
In terms of technical indicators, the Relative Strength Index (RSI) is at 52.85, in a neutral-to-bullish zone, indicating that market bullish sentiment holds the upper hand and a short-term price increase is likely. However, short-term MACD momentum has not yet fully recovered, suggesting that the current move is closer to a post-decline rebound and repair rather than a confirmed start of a new primary uptrend.
Currently, the overall candlestick structure has formed an inverse head-and-shoulders pattern, with the future trend remaining bullish. The first upside target will test the August 17 high of $1,827.99. If the price breaks through and consolidates above this level, it will open up upside room toward the $2,000 mark.
On the downside, key attention should be paid to the August 24 low of $1,416.56. If the stock falls below this level, it may test support near the 144-day moving average ($1,320). If this level is lost, the price could drop further toward the $1,000 mark.
Find out more